Tracking ICE immigration detainers with Klaxon and pdftotext
We found a spike in the number of inmates with detainers requested by U.S. Immigration and Customs Enforcement by watching for updates to a web page and parsing PDFs.
Texas county jails report counts of inmates with ICE detainer requests to the Texas Commission on Jail Standards each month, and the reports have potential to show immigration enforcement trends broken down by county. Unfortunately,
- The reports are PDFs
- The TCJS website only includes the most recent report
Fortunately,
- The PDFs have parse-able embedded text
- TCJS responds to requests for previous records
A few tools we learned at NICAR and a collection of reports dating to 2011 allowed us to identify a large spike in the number of inmates with ICE detainers between January and February within hours of TCJS posting its report.
Our new instance of Klaxon – The Marshall Project’s change detector – messaged our Slack channel overnight, setting a process of PDF parsing and analysis into motion.
I downloaded the fresh PDFs and applied the -layout option of pdftotext. Although Tabula does a fine job converting TCJS reports directly to CSVs, I decided parsing rows of pdftotext output would offer me more control to catch errors. For better or worse, that extra control meant I wrote lots of parsing logic:
for line in txt_file:
    line_split = re.compile('\s{2,}').split(line) # split on multiple spaces
    first_item = line_split[0].strip()
    if (first_item != '' and
        first_item != 'COUNTY' and
        first_item != 'Immigration Detainer Report' and
        first_item != 'Total'):
        # write line items to a csv
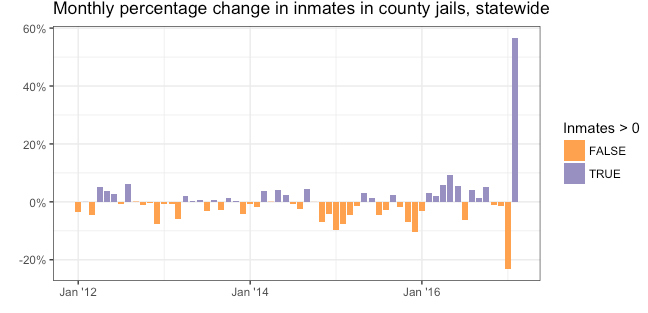
After rounds of trials and errors and double-checking against source PDFs, I had a csv files with rows for each county’s detainer report and the TCJS statewide totals. A quick ggplot2 chart of monthly percentage change indicated statewide swings in recent months.
dat.pct %>%
  ggplot(aes(x=as.Date(date),
             y=Inmates,
             fill=Inmates > 0
             )
) +
  geom_bar(stat='identity') +
  scale_y_continuous(labels = scales::percent) +
  scale_fill_manual(values=c("#f1a340", "#998ec3")) +
  scale_x_date(date_labels = "%b '%y") +
  labs(x='', y='', title='Monthly percentage change in inmates in county jails, statewide') +
  theme_bw()
Phil Jankowski reported the trend while I bulletproofed the numbers against the source PDFs.
With these tools and a healthy dose of data caution, we can add the TCJS reports to the datasets we watch for state and local trends.